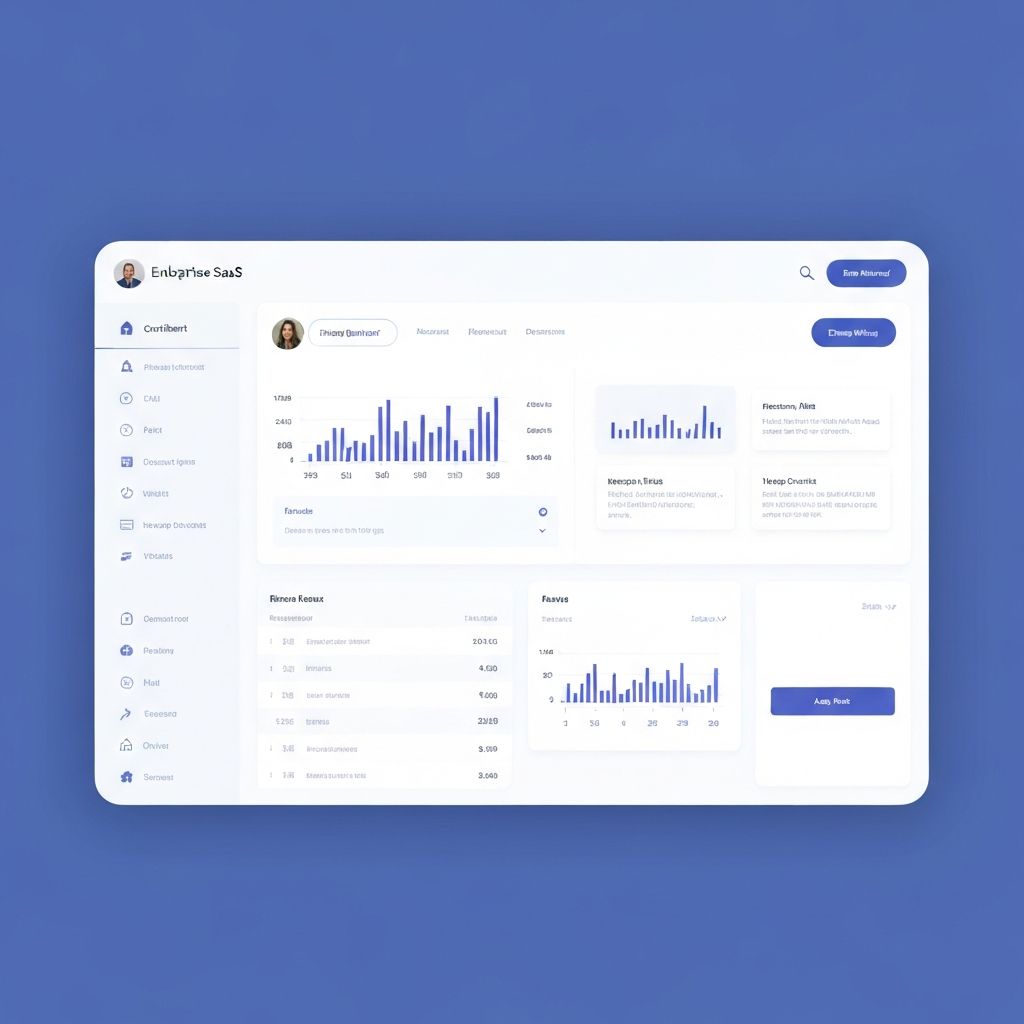
Canvas Enterprise UI
Redesigned the core enterprise dashboard experience using a systematic approach. Created a density-aware component framework that adapts to data-heavy and content-light contexts with consistent interaction patterns.
Role
Product Designer, Systems
Timeline
Mar 2025 - Aug 2025
Team
3 Designers, 4 Engineers, 2 PMs
Impact
WCAG AAA / 40% fewer support tickets
Overview
Vertex Analytics serves enterprise customers who live in their dashboards 8+ hours a day. The existing UI had grown organically over 5 years, resulting in inconsistent density, competing interaction patterns, and poor accessibility scores. Canvas was a systematic redesign that introduced density modes, consistent data patterns, and AAA compliance.
The Problem
Power users were drowning in inconsistent interfaces. The same data table component behaved differently across 4 product areas. Accessibility audits revealed 200+ WCAG violations. Support tickets about 'confusing UI' accounted for 35% of all customer contacts.
Process
Project Phases
User Research
3 weeksShadowed 12 enterprise users across 4 customer accounts. Mapped information density needs, identified pain points in existing workflows, and established baseline usability metrics.
Deliverables
Density Framework
4 weeksDesigned a three-tier density system (compact, default, comfortable) that adapts spacing, font sizes, and component sizing. Users can choose their preference, and the system responds accordingly.
Deliverables
Pattern Unification
6 weeksConsolidated 4 different data table implementations, 3 form patterns, and 5 navigation models into one consistent set. Every pattern was documented with clear usage criteria and interaction specs.
Deliverables
Accessibility Overhaul
4 weeksSystematically remediated all 200+ WCAG violations. Implemented proper focus management, ARIA patterns, color contrast checks, and reduced motion support across the entire component set.
Deliverables
Rollout & Measurement
3 weeksPhased rollout across product areas with feature flags. Measured support ticket volume, task completion time, and user satisfaction scores at each milestone.
Deliverables
Results
Outcomes
AAA
WCAG compliance achieved
40%
Reduction in UI-related support tickets
3
Density modes available to users
28%
Improvement in task completion speed
Reflection
"Enterprise design is about respecting your users' time and cognitive load. The density framework was the breakthrough - it acknowledged that one size doesn't fit all, even within the same product."